本次美国代写是集成电路相关的一个Homework
In this assignment you will use Cadence tools to simulate the response of the
following circuits. All transistors have equal widths = 60 microns and length =
30 microns. Vdd is equal to 3V. Attach simulation plots and with proper
annotations. DO NOT SUBMIT A SCREEN CAPTURE OF YOUR RESUTLS !
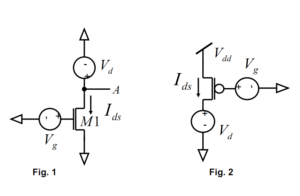
1 ) For circuit in Figure 1, perform a dc parametric analysis by plotting the drain
current Ids when Vd is varied from 0 to 3 V in steps of 0.01V, while Vg is varied
from 0 to 3 V in steps of 0.1 V. For each curve show the effective voltage Vdsat
or Veff (minimum Vd before the transistor enters saturation) [ 4 points ].
2 ) For circuit in Figure 1, perform a dc parametric analysis by plotting the logarithm
of the drain current log(Ids) when Vg is varied from 0 to 3 V in steps of 0.01V,
while Vd is varied from 0 to 3 V in steps of 0.1 V. Identify the sub-threshold,
above-threshold and moderate inversion regimes. [ 4 points ].
3) Repeat questions 1 and 2 for circuit in Figure 2 [8 points].
4) Estimate the small signal parameter gm and gd using the previous results. You can
either export the data from 1) into a csv file or in MATLAB or you can use the
calculator tool in Cadence [4 points].


