这是一个金融数据分析的group project代写案例
1. Abstract
New York is a global hub of business and commerce. It is a major center for banking and finance, retailing, world trade, accountancy, and insurance around the world. Therefore, it attracts capital, business around the world. The New York Stock Exchange is by far the world’s largest stock exchange by market capitalization of its listed companies at US$21.3 trillion as of June 2017. Hence, the NYSE Composite Index is the most representative in the world.
In this report, we use two models to find the best portfolio in five different stocks in NYSE. One is the traditional Markowitz’s Mean-Variance Portfolio Optimization, and the other one is Single Index Market Model.
2. Motivation
The NYSE Composite Index is a stock market index covering all common stock listed on the New York Stock Exchange, including American depositary receipts, real estate investment trusts, tracking stocks, and foreign listings. It includes corporations in each of the ten industries listed in the Industry Classification Benchmark and over 2,000 stocks are covered in the index. As a result, we would like to find the best portfolio in five different stocks in NYSE Composite Index with different models.
3. Model
(1) Markowitz’s Mean-Variance Portfolio Optimization
We use this model to find the optimal portfolio weights to balance between the mean and variance of future portfolio return. And the basic assumptions are:
- * All k returns of assets included in the portfolio are normally distributed
- * Investors only care about the expected return and risk
- * Investors want to maximize the expected return
- * Investors want to minimize the risk
(2) Single Index Market Model
The Single Index Market Model is an asset pricing model to measure both the risk and the return of a stock. The model has been developed by William Sharpe in 1963 and is commonly used in the finance industry. The Single Index Market model assumes that there is only 1 macroeconomic factor that causes the systematic risk affecting all stock returns and this factor can be represented by the rate of return on a market index.4. Data
In this project, we downloaded the data through Quandl.
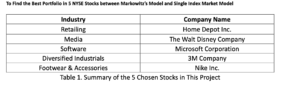
There are 5 randomly selected NYSE stocks in total. The covered period is five years, starting from 1st November, 2013 to 30th October, 2018. The details of chosen NYSE stocks are as follows:
5. Methodology
(1) For Markowitz’s Mean-Variance Portfolio
The efficient frontier of a portfolio describes the minimum variance portfolio (MVP) given an expected portfolio return μ0 . Therefore, we can interpret the problem into the following
structure, xi denotes the chosen portfolio weight:
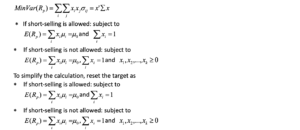
There are two methods to solve this problem. The first is analytic method using calculus tools like Lagrange multiplier method; and the second is numerical method using software like excel, PORTimizer and python.


